Deployment: Post-Processing
As the *metadata_classified.csv file, generated during the
classification step, still contains
multiple rows for each tracked insect (= track_ID), we will use the
process_metadata.py
script for metadata post-processing.
The output of the script includes a *top1_final.csv file in which each row
corresponds to an individual tracked insect and its classification result
with the highest weighted probability.
Installation
It is assumed that you already followed the instructions in the
classification step and successfully ran the
classify/predict.py
script to classify the cropped insect images and write the classification
results to *metadata_classified.csv.
- Navigate to the
YOLOv5-clsfolder, in which you downloaded theinsect-detect-mlrepo. -
Install the required packages by running:
Run metadata post-processing
-
Navigate to the
YOLOv5-clsfolder and start the post-processing script by running:py insect-detect-ml-main/process_metadata.py -source "yolov5-master/runs/predict-cls/<NAME>/results" -size 350 200 -images 3 1800Insert the correct name of your prediction run at
<NAME>. If you used a platform with a different size as the small platform (350x200 mm), change-sizeto your frame width + hight in mm accordingly.Optional arguments
-sourceset path to directory containing metadata .csv file(s) with classification results-sizeset absolute frame width and height in mm to calculate true bbox size (default: relative bbox size)-imagesremove tracking IDs with less or more than the specified number of images-durationremove tracking IDs with less or more than the specified duration in seconds
When using the default capture frequency of one second, it is highly recommended
to use -images 3 1800 to remove all tracked insects (= track_ID) with less
than 3 or more than 1800 images before saving the *top1_final.csv.
This can exclude many false tracking IDs, e.g. insects moving too fast to be
correctly tracked ("jumping" IDs) or objects that are lying on the platform and
are incorrectly detected as insects. Depending on the speed and accuracy of the
deployed detection model, as well as the capture frequency and respective recording
duration, adjusting these thresholds or using the -duration argument instead, can
result in a more accurate estimation of insect abundance/activity (= platform visits).
Overview plots
Several plots are generated by the
process_metadata.py
script that can give a first overview of the post-processed metadata. For more
in-depth statistics, the final .csv file should be analyzed with software such
as R + RStudio.
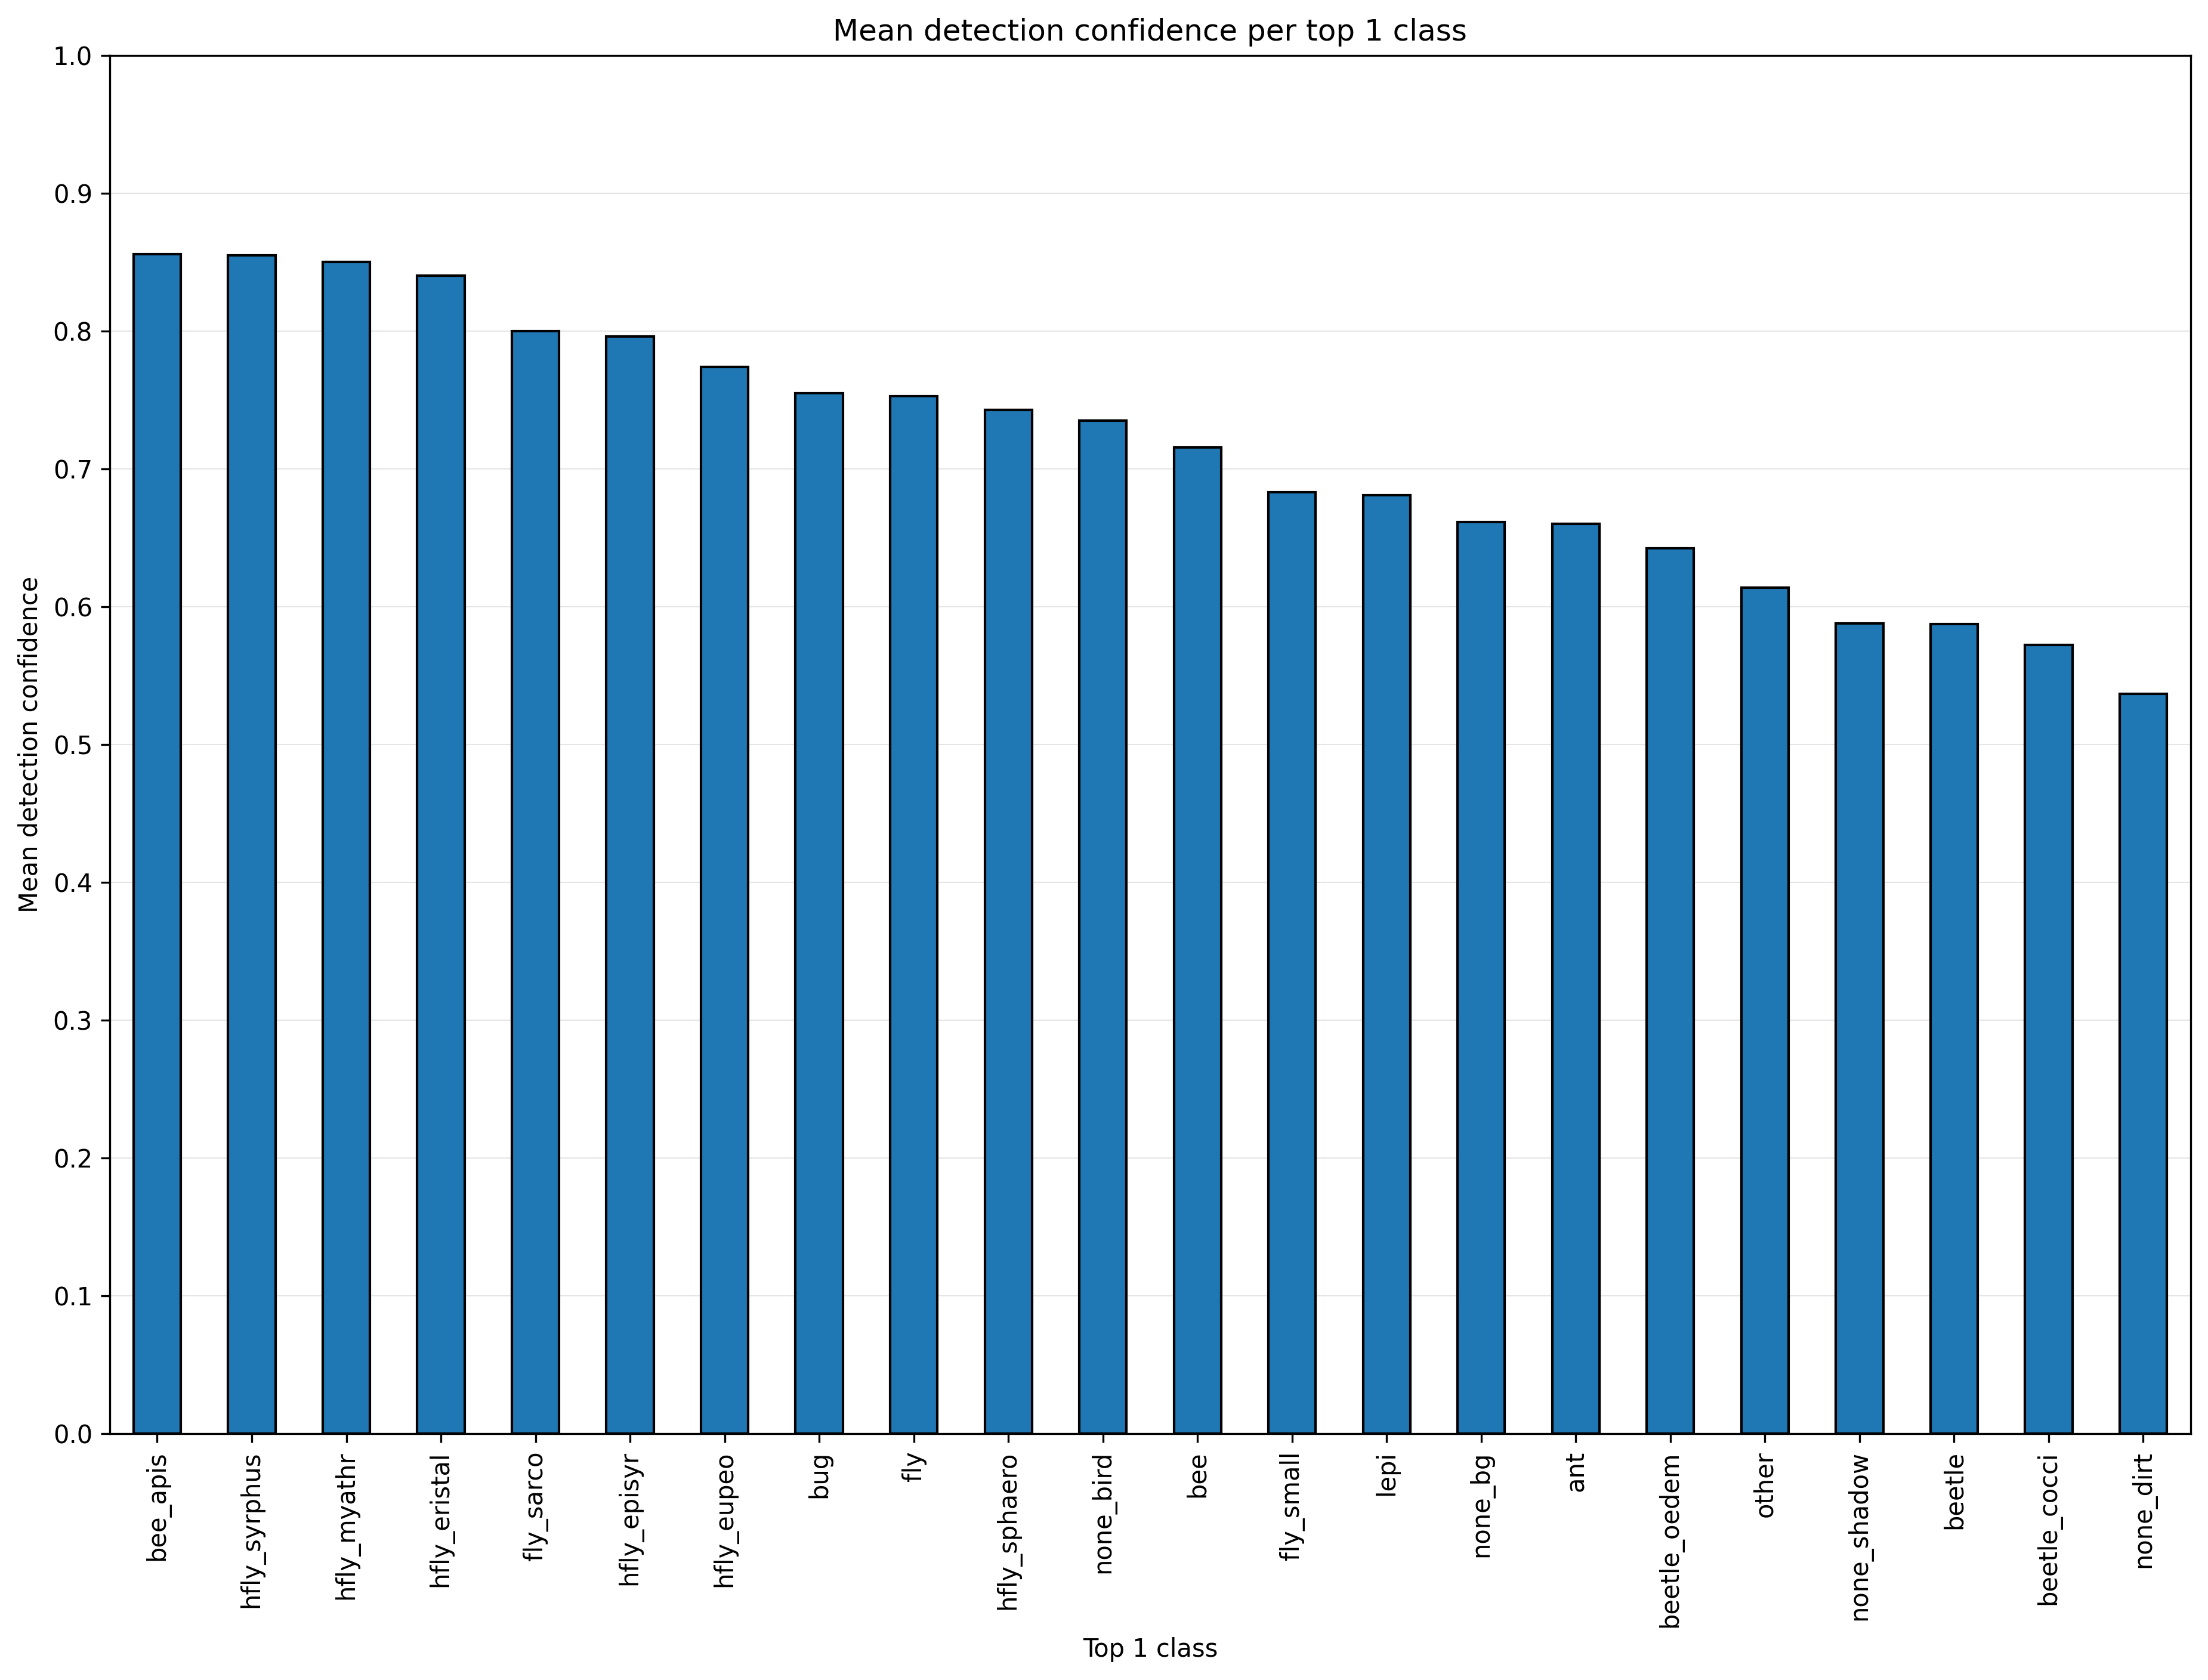
The plot top1_mean_det_conf.png can be used to find cases (e.g. small beetles
in the following example) for which the deployed detection model has a low
confidence score and additional annotated images could increase model accuracy.
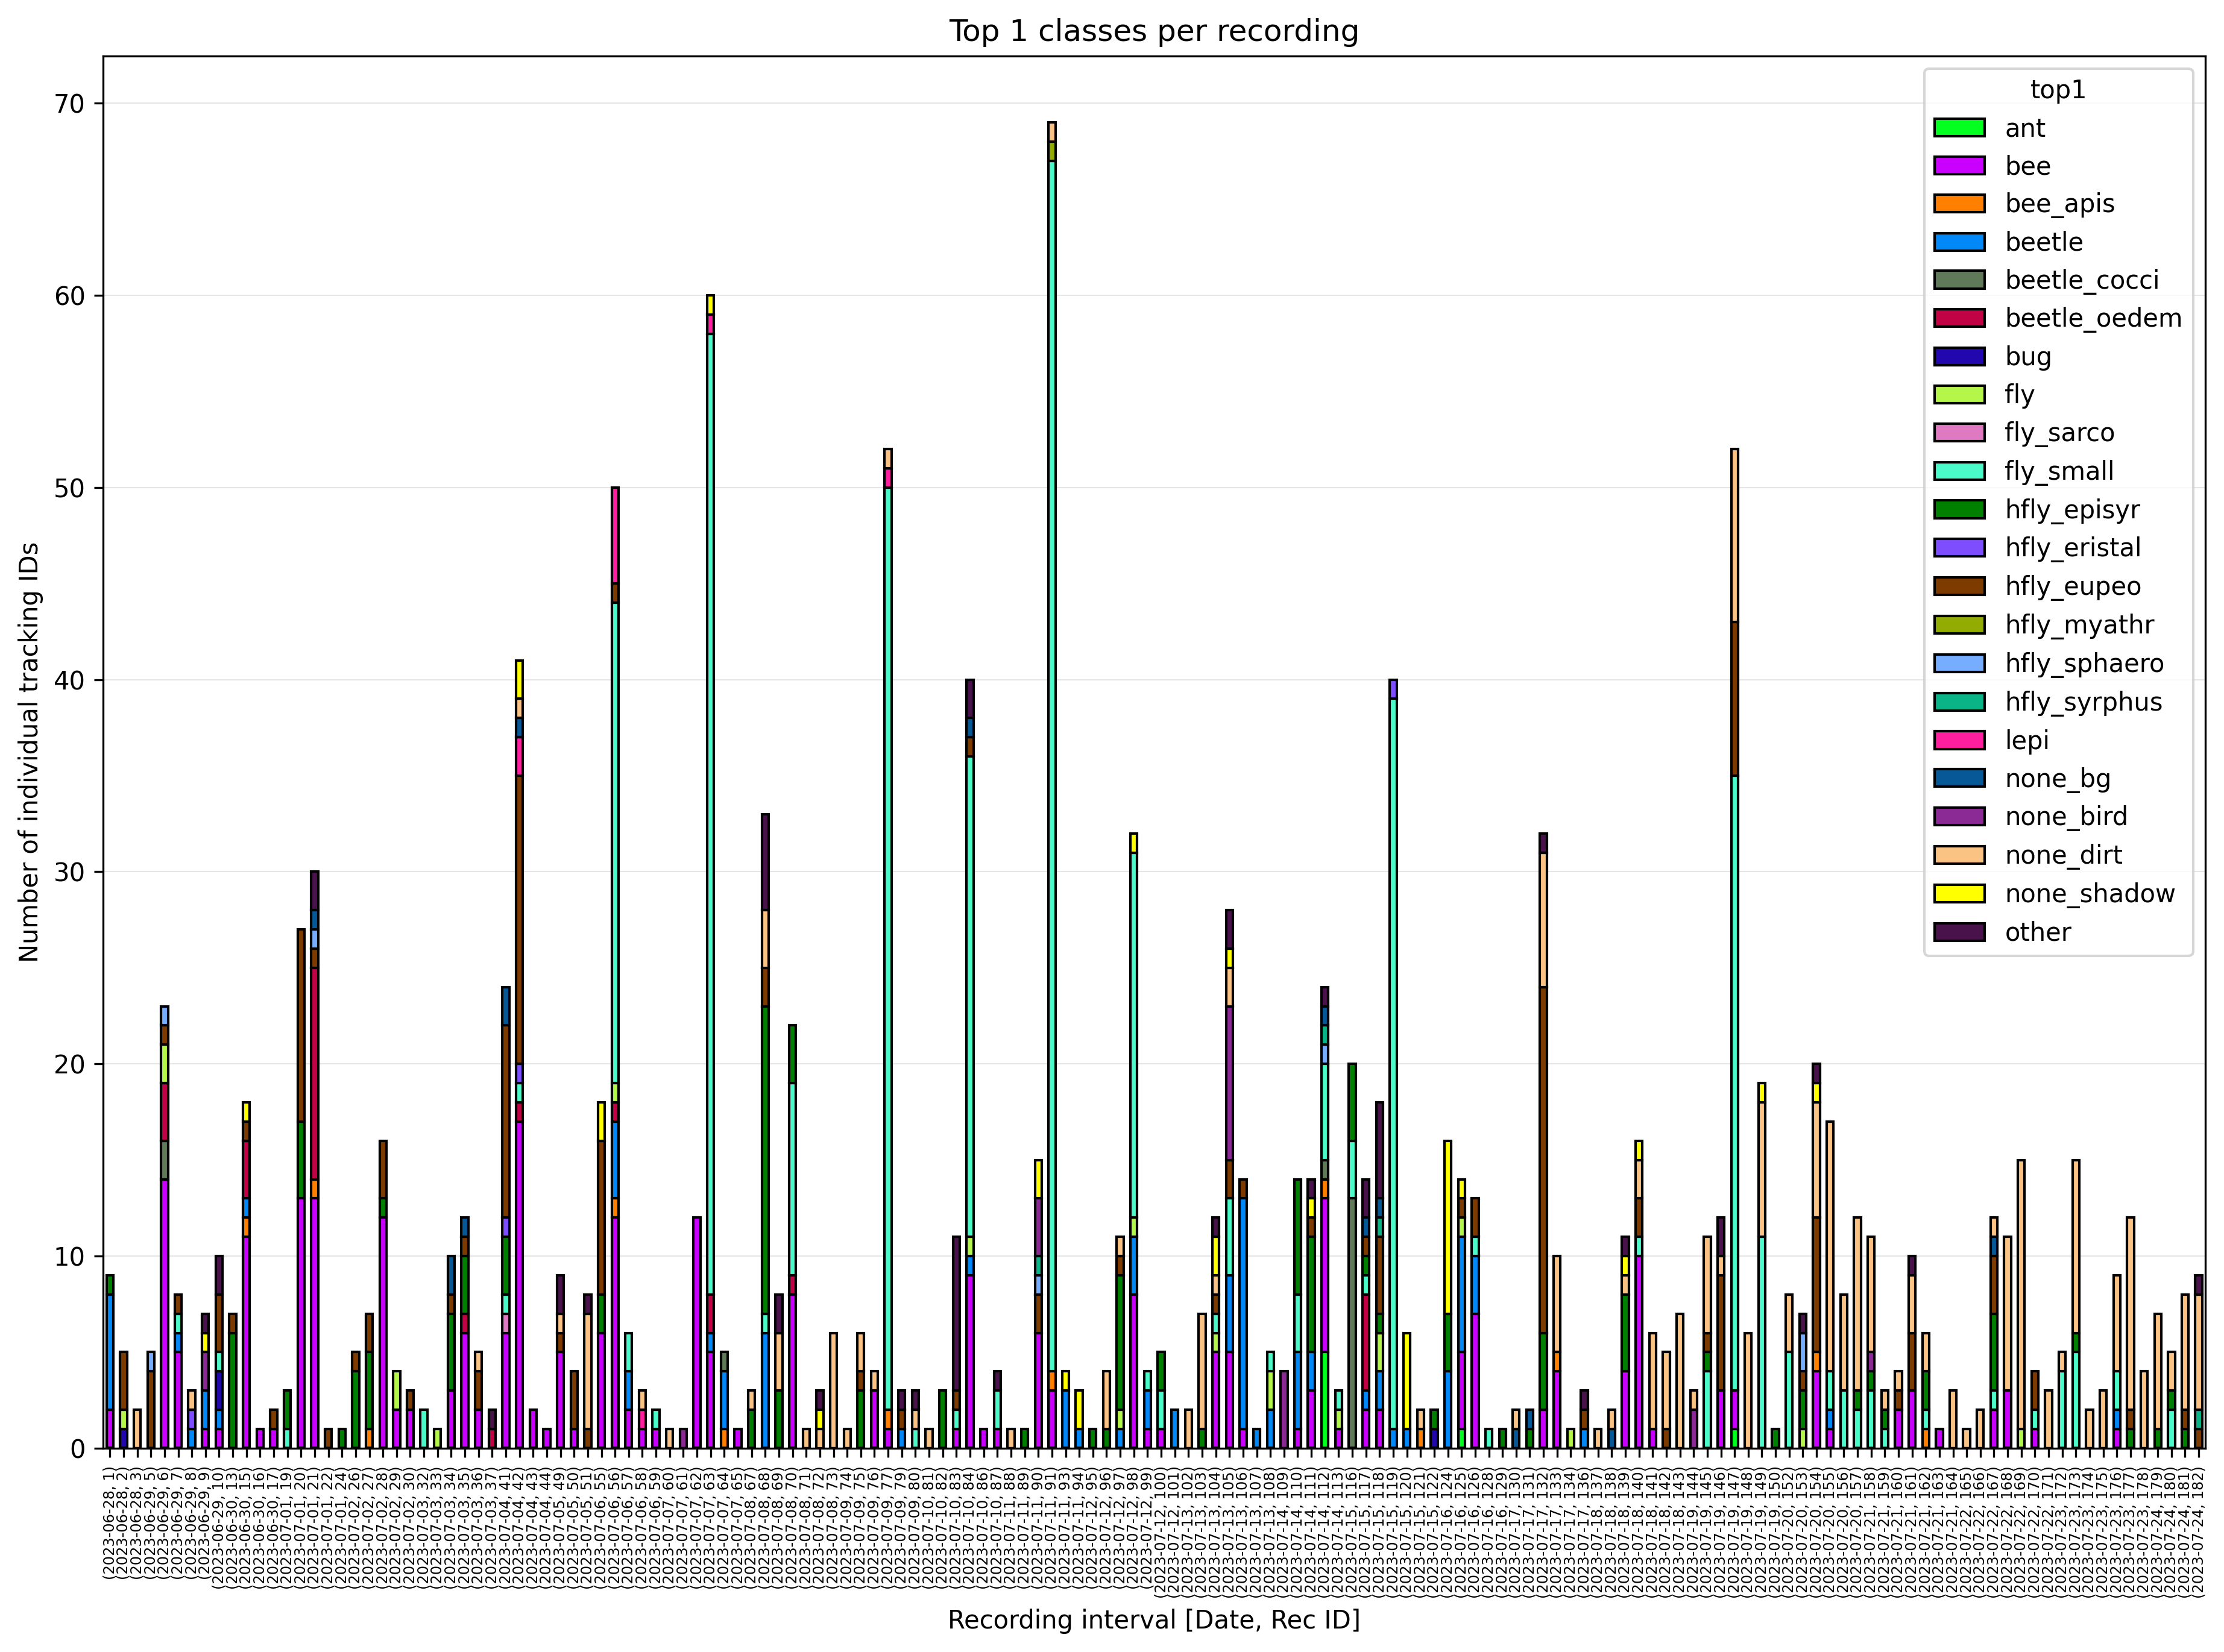
The plot rec_id_top1.png gives a overview of the top1 classes per
recording. In the following example, lower numbers of insects at recordings
early in the day can be noticed. Also an increase of images classified as
dirt (none_dirt) can be observed in later recordings.
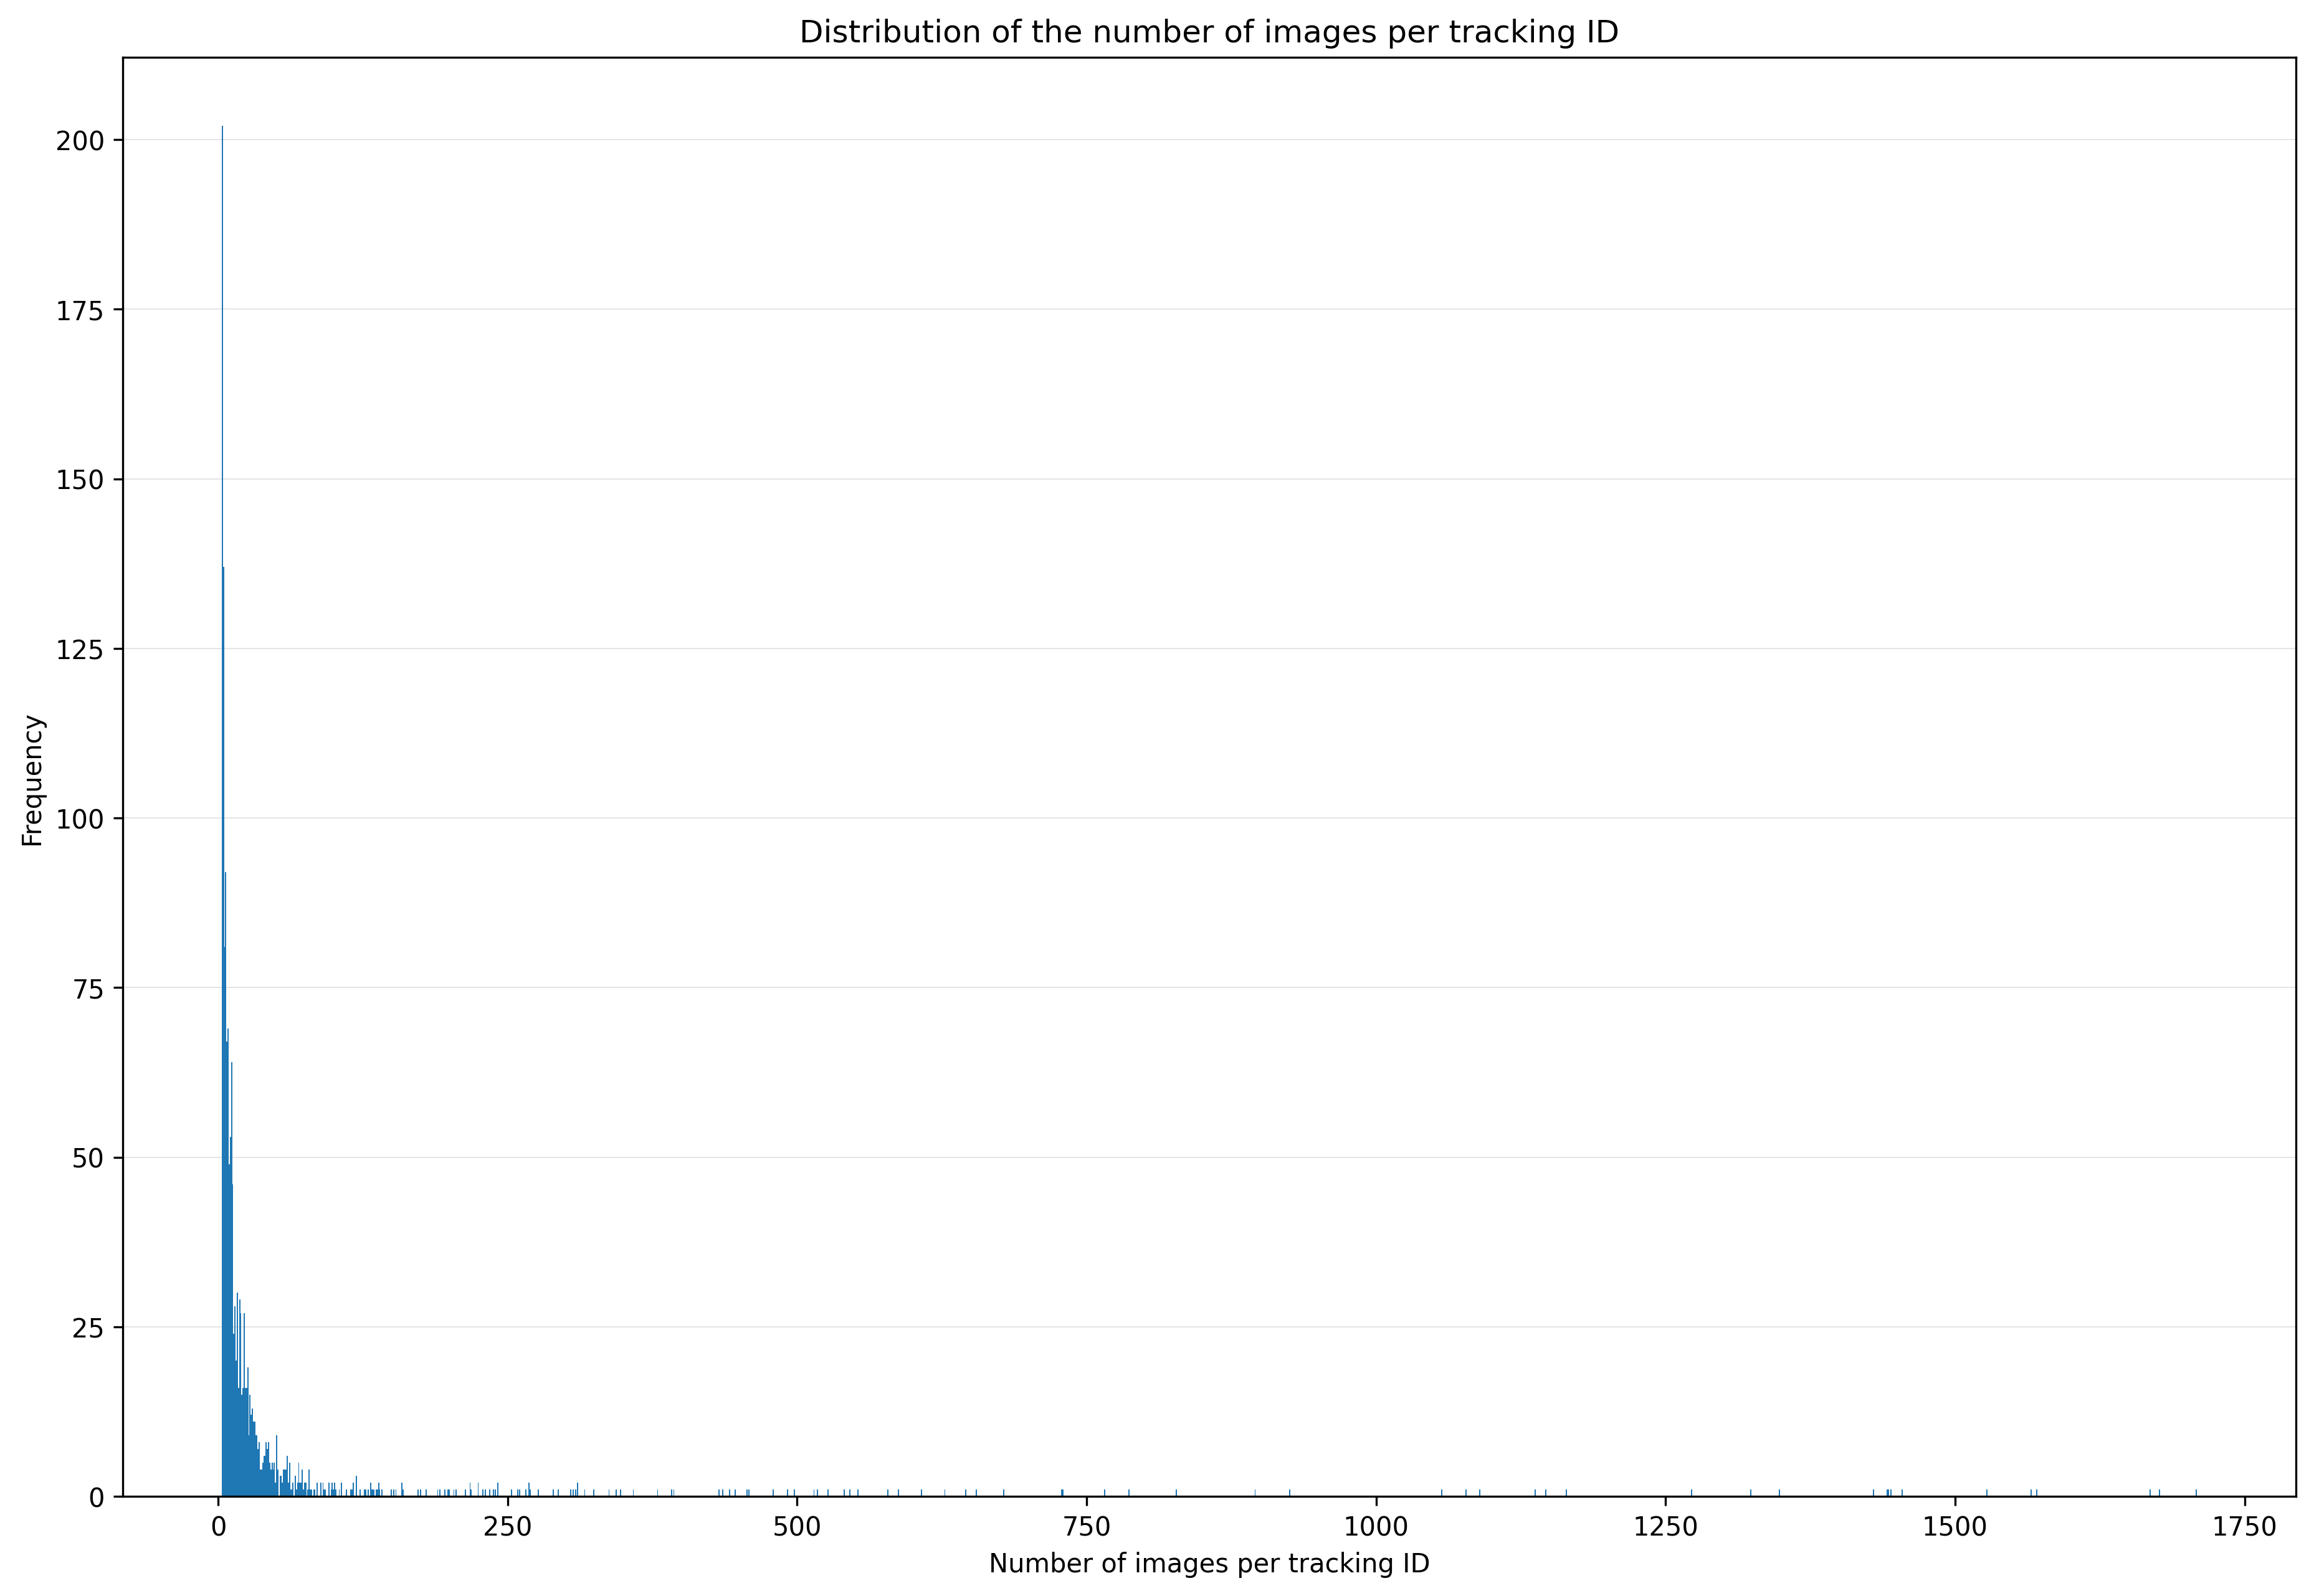
The plot track_images.png gives you information about the distribution of
the number of images (= tracking duration) per tracking ID. It is recommended
to remove all tracked insects with less than 3 or more than 1800 images before
saving the final .csv file. You can also run the process_metadata.py script
without the argument -images or -duration to plot all tracking IDs and
include them in the final .csv file.
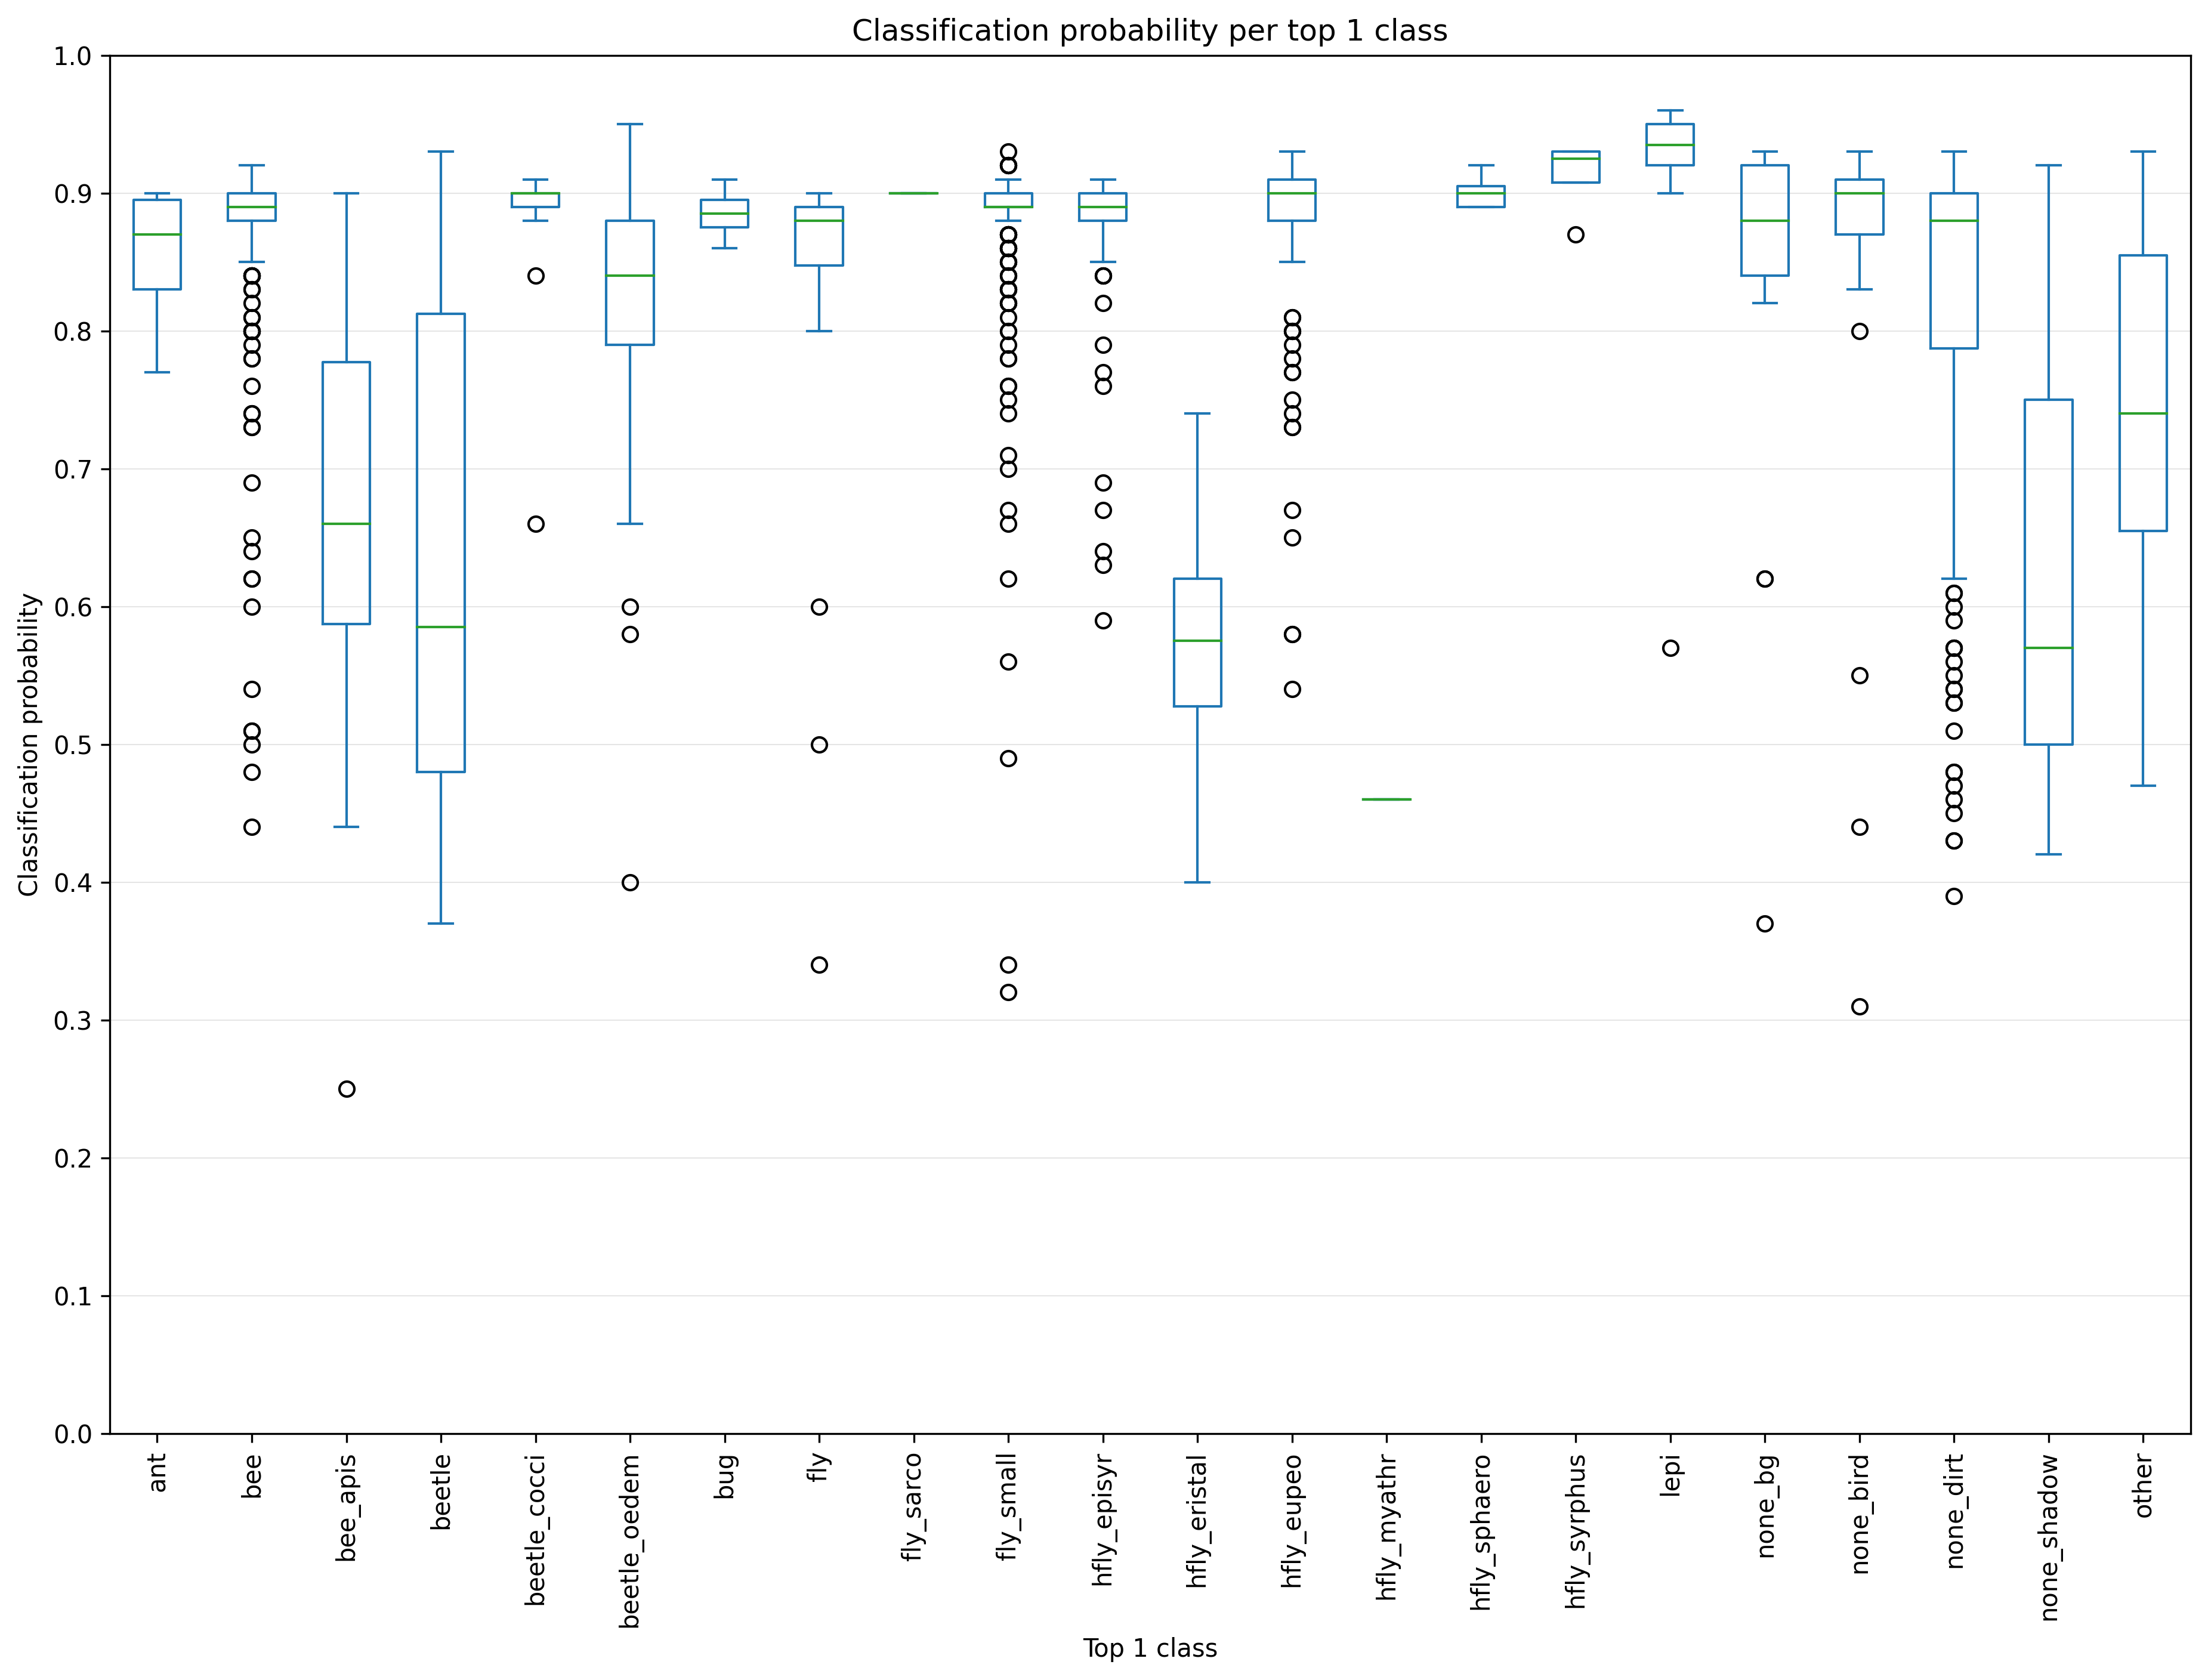
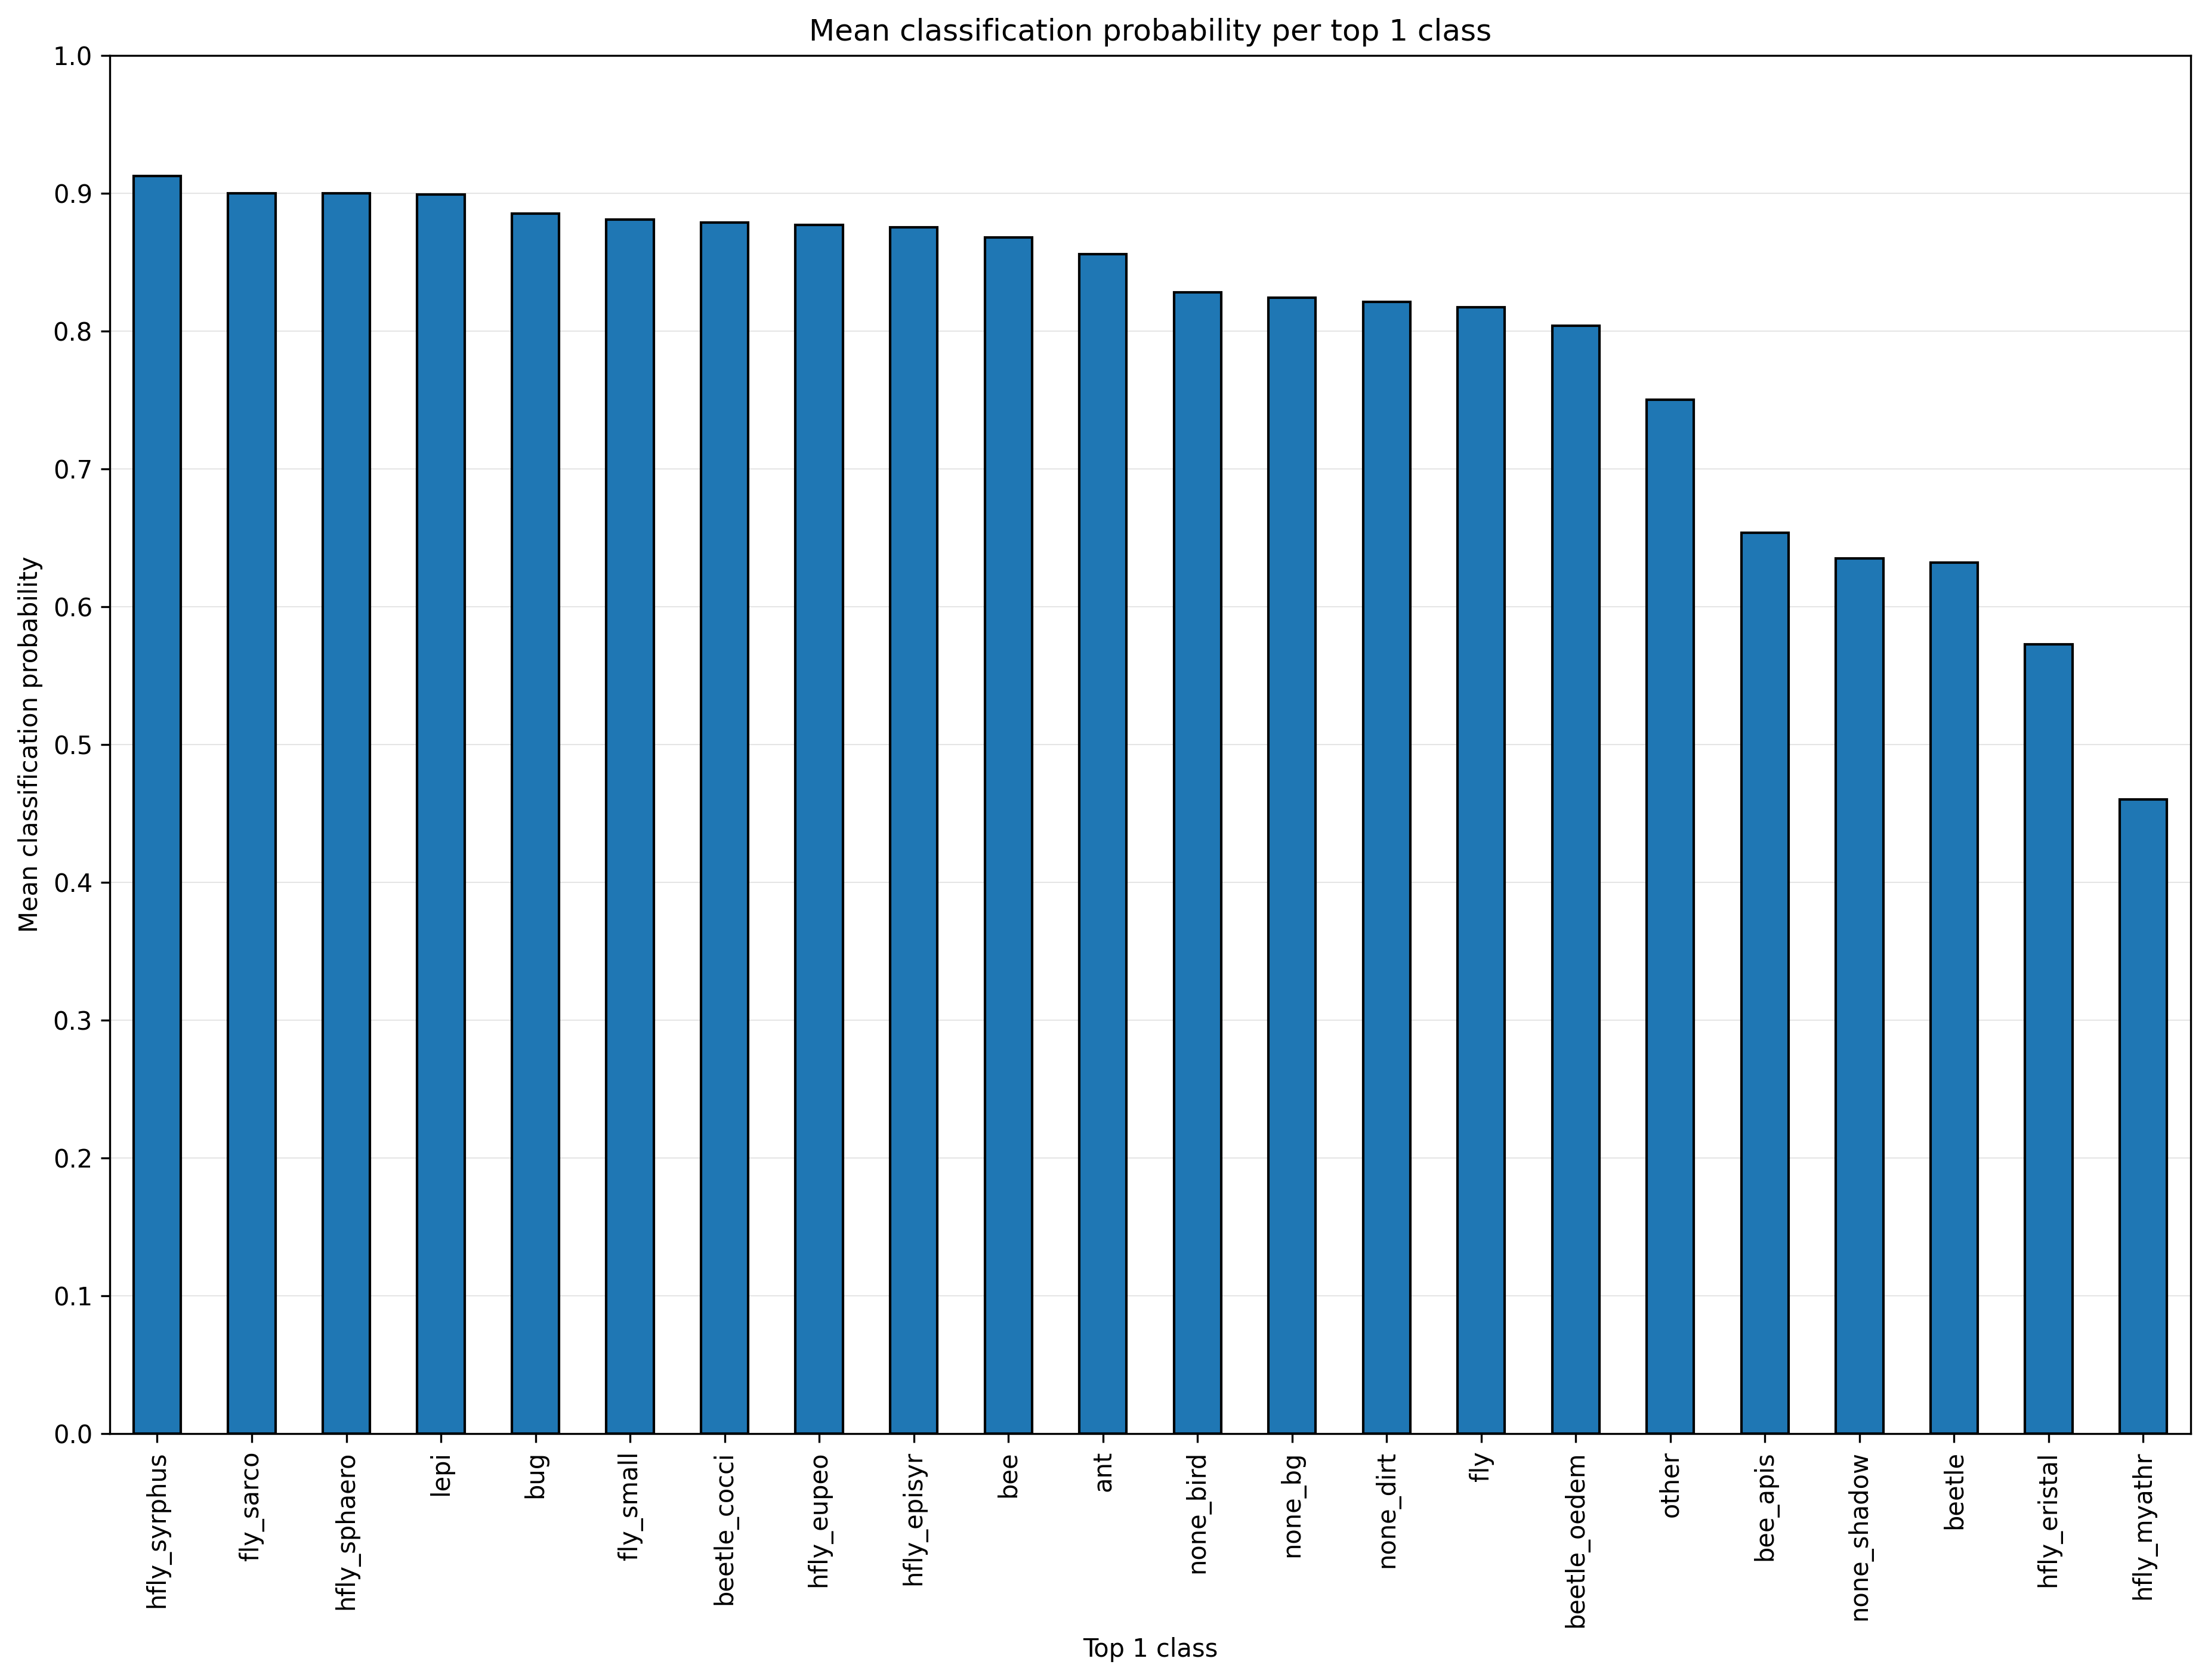
To find cases where the accuracy of the classification model could be improved by
retraining with
additional images added to the basic dataset, you can inspect the plots
top1_prob.png and top1_prob_mean.png. In the following example, a relatively
low classification probability can be noticed for the classes hfly_myathr (but
also only few images), hfly_eristal, beetle and bee_apis. The classified
and sorted images in the folder top1_classes should be inspected in cases of
such low probabilities to find false classification results.